Datasets
Datasets are how you describe your data to Faraday, accomplished through identity sets, events, and traits.
Datasets overview
Datasets are how you describe your data to Faraday. When creating a dataset–accomplished thanks to a connection or a CSV upload–you'll organize your dataset into identity sets, events, and traits.
- Identity sets: identity sets are used to help Faraday identify people in your data, using identifiers like email, name, and address. An identity set is almost always required.
📘Key properties to map
Not all property fields in an identity set are required, but email and address are the most useful for identifying people. The more fields you include, the more likely to match the people are.
- Events: events show Faraday how to recognize actions taking place in your data, such as purchases, renewals, click events, upsells, etc. Dates are often the most useful piece of data for events. Events can include event properties, which are data points about the event itself, such as product category.
- Traits: traits are interesting data points that can enhance the usefulness of your data in Faraday, but aren't used to identify a person or an event (e.g. whether a person rents or owns their home, income, hobbies, etc).
🚧️Deleting events and traits from a dataset
Deleting an event or trait from a dataset without first deleting any cohort that is defined by the event or trait may cause the cohort to error, and result in a removal of the population in the cohort. Ensure that you delete any resources that are using the event or trait–or change the cohort definition–before you delete it.
A completed dataset's identity sets, events, and traits will help power everything you do in Faraday. Identity sets are used for identity resolution, events for building recommender predictions, and both events and traits for building cohorts. From there, your cohorts fuel the predictions you create in outcomes and persona sets.
For dataset creation instructions using both the Dashboard UI and API, see our how-to docs for event streams.
👍Key takeaway: datasets
Datasets are how you describe your data to Faraday. They're created through identity sets for identity resolution, events to mark key actions in your data, and traits to note interesting data points about individuals. Once built, what you define within a dataset will power everything you do in Faraday.
Refreshing data in a dataset
Sometimes it might be beneficial for you to add additional data to a dataset. For example, if your original dataset was a manual upload of order data from the previous month, and you'd like to append this month's order data.
📘Automatic data sync
If you've configured a dataset via connection to your data warehouse, it will automatically be kept up to date. As such, this section is focused on manual, CSV uploads.
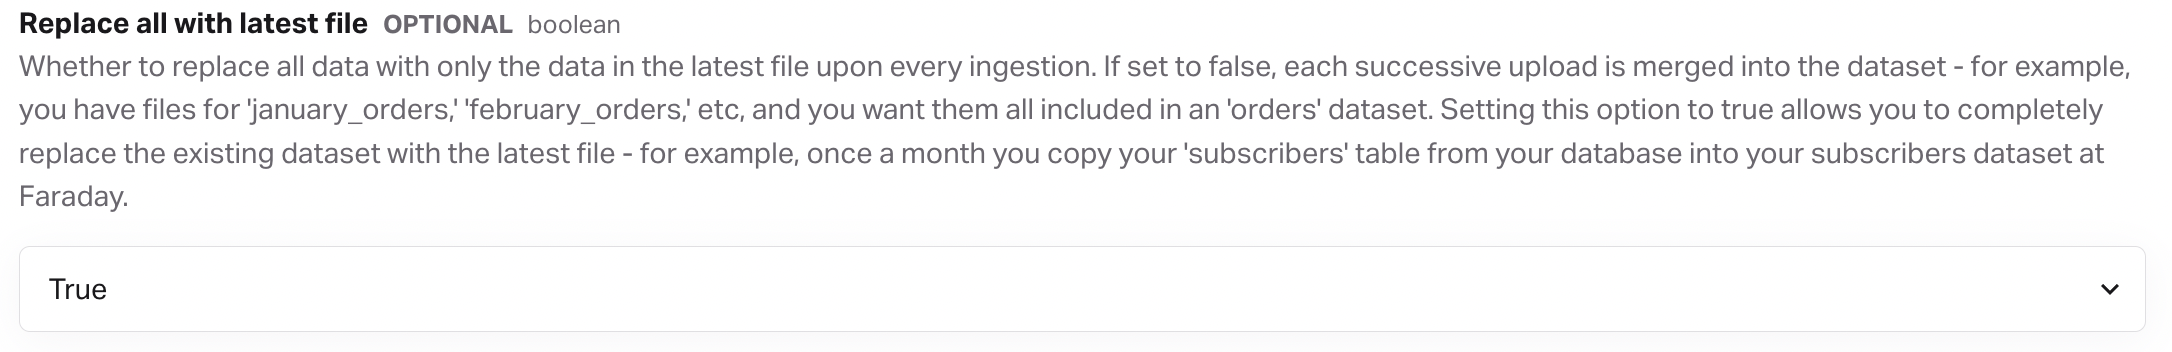
- To start, you'll want to head to the dataset you'd like to configure, expand the advanced tab, and find replace all with latest file. By default, this setting is set to false, so each time you upload data via the below steps, the new file is merged into the dataset. If the value is changed to true, the entire dataset is replaced with a new file upload.
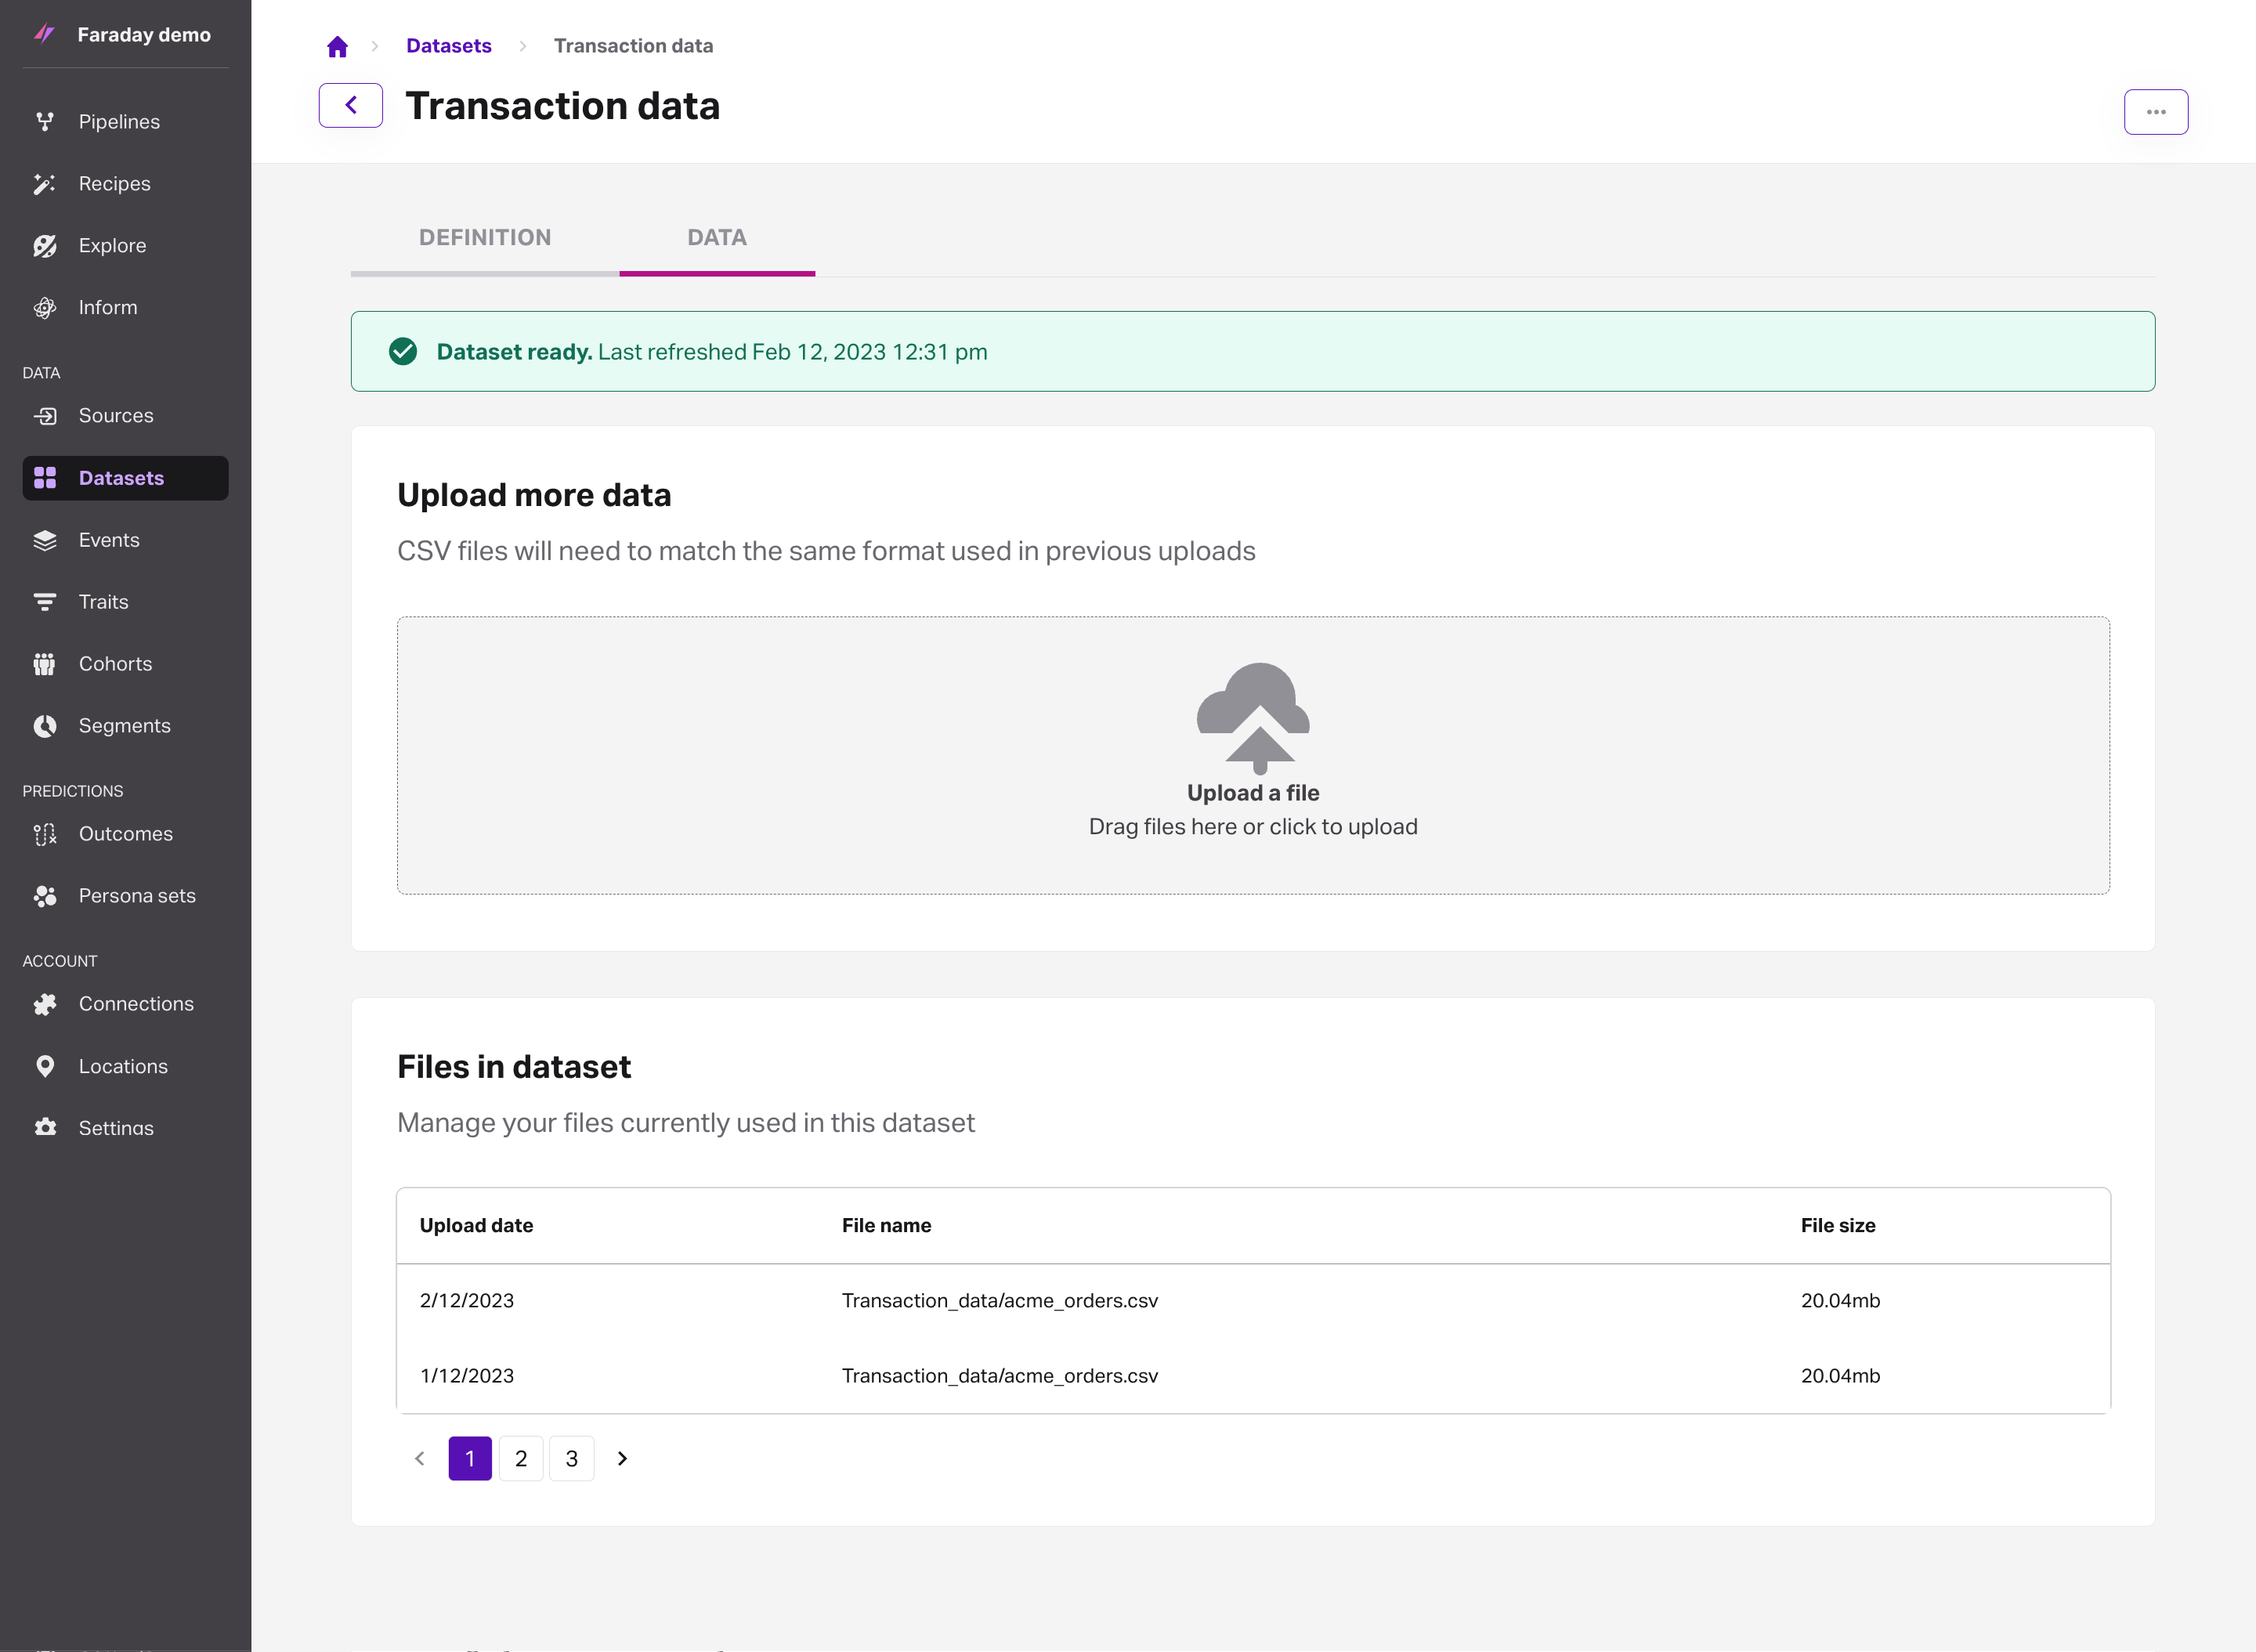
- Once in the data tab of your dataset, drag your new file to the upload prompt or click to open the file picker. When your additional file's upload is complete, it will appear in the files in dataset list and the dataset status banner at the top of the dataset (green for ready, red for error) will display the upload's refresh date.
🚧️File formats
Your additional file upload must be in the same format as the data uploaded previously in this dataset. Columns in the new CSV must exactly match those in the original CSV.
- With your new data uploaded, you can now dig back into your predictive building blocks–your cohorts, outcomes, personas, and more–and make any required edits. For example, your newest upload may have included second purchases from a customers who were in your first upload, so you can now jump into cohorts to create or update a repeat purchaser cohort.
Standard fields to send to Faraday
Faraday matches your customers into our database at the individual level, so the more info about each individual in your data, the more likely you are to have a good match rate. Date fields are extremely important when building predictive models. As an example, we like to know if someone is a customer, but more importantly, we need to know when they become a customer, or when they purchased a certain product, or took some other specific action. Often, many of the key date fields in your data might live in the orders table in your database.
| Standard field | Description |
|---|---|
| First name | Customer first name |
| Last name | Customer last name |
| Street address | Customer street address |
| City | Customer city |
| State | Customer state |
| Postcode | Customer postcode |
| Customer email address | |
| Phone | Customer phone number |
| Customer | The field in your data that determines a customer |
| Lead data | The field(s) in your data that determines a lead. Do you have various lead categories? What determines when a lead converts? Lead status? |
| Product data | Date of purchase, item purchased, price of item, product types, number of orders |
| Subscription data | Date the subscription started and/or ended |
| Customer ID | The field that will be used to match your predictions back to the appropriate customer in your stack (e.g. Salesforce ID) |
Understanding data in Faraday
Event streams
If you've already checked out our article what data Faraday expects then you're well on your way to understanding what is specifically needed for prediction modeling in Faraday's system.
However, to drive home these best practices, here are some hypothetical examples to help understand how we bridge the gap between the incoming data we take and the models that you help design to predict your desired outcomes!
Even if you seem to understand the concept of an event stream it is always nice to see visual examples that show the shape of the data as you look at it in a database or spreadsheet.
Faraday has 4 base-level data points we utilize when we're processing any particular stream of events that you give us:
- date (datetime)
- value (i.e. - monetary value of said event per your business)
- product(s)
- channel (e.g. - "acquisition source")
📘Data Faraday wants
The data you upload isn't limited only to the above - give us all data points you desire to, which are meaningful to your business outcome!
Example 1: item-level data

Example 2: customer-level data

Example 3: event-level data

Example 3, the event-level data image, is the key to focus on. There are a couple assumptions here:
-
The event examples above are based on orders. What if your business doesn't specifically operate on orders? No problem, you may simulate this same data for any specific event stream that constitutes a individual's behavior in your system:
-
Insurance policies started
-
Emails clicked or bounced
-
Leads created
-
Investments made
-
Etc.
-
-
We also assume your product set within the file is made up of 10-20 (max) easily-readable grouped categories. These are high-indexing across the historical events you provided, so ideally they have coverage across most of the events that have happened.
- Overall, you might have 1000 different products.
- These products may need to be mapped from SKUs or pattern-matched according to some rule you have:
- "Has the word 'deluxe' in the title."
- "SKUs beginning with "AM-" are our armchairs."
If you need to map or group your products in a more concise manner that might not be a simple pattern you can elucidate, a "SKU mapping" spreadsheet can supplement your data. We will take your mapping spreadsheet and join it direct to your data as if you provided it in the main dataset.
Example of SKU mapping

Why would Faraday be interested in all the metadata that accompanies a particular event record (i.e. - value, channel, product, etc)? Read the next section to learn more about how we use these features to roll-up data by individual.
Roll-ups
Many clients may come to the table providing data that is "rolled up" or "aggregated" already, which does not provide the event level data Faraday requests. While this type of data is holistically useful for business analysts and business leadership to understand trends, patterns and summary attributes about an individual, Faraday already has a automated system in place to do just this.
Example of rollup data:

The reason Faraday is asking for event-specific data is because our prediction modeling system is built on individuals entering certain cohorts, based on a date. Having only the first or last date of an event (as in the above screenshot) actually hinders our ability to model off of your customers.
Faraday will take in your data:
- Event-by-event, along with all other associated fields in the row.
- Match these events to known identities using our algorithm
- Make assessments on meaningful, strong-signaled patterns present.
Therefore, rollups are the way to represent the aggregation of a single field in an event stream, based on some window prior and relative to the reference date provided in its definition. These can be leveraged by cohort membership and joined directly to those individuals for enrichment to the outcome. More common examples of types of aggregations might be (but not limited to):
-
COUNT
-
SUM
-
UNION (distinct values)
-
MAX
-
MIN
-
windowed DAYS FROM
which may be translated into things like:
-
COUNT of orders from day 1 to day 90
-
SUM of policy payments received from day 30 to day 60
-
- UNION of distinct browser types viewing pages last 7 days
-
MAX value of investments from 284 to 365 days
-
MIN value of payment (all time)
-
DAYS FROM first event to last event
The result of a particular rollup is a single feature for a household (specifically, an "individual") in either the training or scoring data. These stand as important first-party data characteristics that can be used to tune and/or queue your model to providing a greater level of specificity on behaviors you may not have even know existed within the data.
Deleting a dataset
Before deleting a dataset, ensure that all resources using it, such as an event stream, any cohorts using those event streams, any outcomes using those cohorts, etc, are no longer using it. Once there are no other resources using the dataset, you can safely delete it.
- Dashboard: click the options menu (three dots) on the far right of the dataset you'd like to delete, or upper right when viewing a dataset, then click delete.

- API: use the delete dataset API request.
📘Deleting resources
See object preservation for info on the order in which resources should be deleted.